Size, Democracy & Political Control
Size, Democracy & Political Control:
Measuring
the effect of community size on local political autonomy
“…The institutions of a township are to freedom what primary schools
are to science; they put it within reach of the people; they make them taste
its peaceful employ and habituate them to making use of it. Without the
institutions of a township a nation can give itself a free government, but it
does not have the spirit of freedom.” Alexis de Tocqueville, Democracy in
America
If democracy in government is understood as the personal
involvement of citizens in the functions and power of governance, then the
strongest democracy can be found where power and the responsibility of decision
making are the least delegated by citizens to their representatives, and where
individuals are most able to personally interact with and control the levers of
government. This is reflected in Frank Bryan's “Real Democracy” (Bryan, 2004)
and his body of work on town meetings in Vermont; smaller political entities
lead to more and better participation by citizens in the work of government,
and as important decisions are delegated up the pyramid of representatives the
interest of citizens and their civic participatory ethic declines. As the populations
of polities grow larger the decisions, resources and the meat of governance
become centralized in the pursuit of efficiency, predictability and
convenience. Bryan’s work demonstrates that this leads to a reduction in the
involvement of citizens in the works of government, the definition of weaker
democracy. Large polities suffer from the inherent difficulties of remoteness;
a large, central government must maintain a one-size-fits-all approach to
governance, an approach that unavoidably fails to reflect differences in values
and needs between constituents. The
democratic ideal, then, may be small political units exercising meaningful
decision-making authority that reflects the needs and interests of its
relatively few constituents. This is the premise and foundation of federalism,
and a conclusion that is the subject of widespread agreement. (Bell, Brunori
& Youngman, 2010).
The link between democracy and decision-making authority is
important; if voting and deliberative bodies are the forms of democratic
governance, then the substance is in the scope of power wielded by the
democratic process. To get to a fundamental understanding about the variation
in democracy between large and small political units, then, we need to connect
participatory measurements of democracy with some analysis of government in
action – power exercised, decisions made. But decision-making authority is hard
to measure; it could be counted by votes taken, bills passed, regulations
issued or myriad other metrics of bureaucratic machinations. The best
measurements are perhaps the hardest to tease out – positive outcomes,
satisfied constituents, fiscal efficiency, etc. While it’s possible to empirically
study these measurements, they are beyond the scope of this project. Other research
has delved into the fiscal and legal conditions that delineate and foster local
autonomy, or studied the social and political ramifications of local government
from the perspective of its impact on national political involvement. Yet on
the social conditions for democracy and local autonomy, few connections appear
to have been made. (Vetter, 2007).
In this paper I attempt to test a simple argument; democracy
works better in small communities, and if this superior democracy can be
translated into improved power and standing for local governments, then those
states in the U.S. with a higher proportion of citizens living in small
communities should rate higher on measurements of local political power and
autonomy.
Independent Variable
While there are many possible definitions for small
communities in the U.S., for this report I've selected the United States Census
measurement of rural places. The decennial Census defines rural communities as
those with 2500 or fewer residents, and provides the data by state. I've used
the proportion of the state population living in communities with 2500 or fewer
residents as the independent variable; this measure controls for size and is an
adequate proxy for small communities.
Dependent Variable
Local autonomy is a term with definitions that vary by use;
for the purpose of this paper, I adopt the descriptions used by Wollman et al
(2008) and Clark (1984). Local autonomy is understood as the importance of the
role played by the local government in the economy and intergovernmental
relations, the degree of initiative held by local governments to enact limits
on the behavior of residents, and the scope of freedom from constraint and
supervision by state authorities.
Empirically measuring the degree of local political
independence, or autonomy, is a task with no consensus method. In some studies
the Dillon's rule status of particular states are used as a distinguishing
feature. (Richardson, 2011) Dillon's rule, outlined in 1868 by Iowa judge John
Dillon, is the principle that local governments have no original authority; any
political power they may possess or wield is derived solely from the sufferance
of the state. Since this principle of jurisprudence was described, some states
have carved out exceptions by establishing home rule provisions either by
statute or in state constitutions. The scope, consistency and degree of
authority provided by home rule exceptions varies greatly by state and over
time. More importantly, using a Dillon's Rule dichotomy provides limited
correspondence with other measures of local government autonomy. (Richardson,
2011).
Another measure, the Stephens Centralization Index, was first
published in 1974 and updated in 2002. In his 1974 paper, G. Ross Stephens “[...] devised a composite index of state
centralization using the following three components that reflect the relative
distribution of power between the state and local governments: (1) financial
responsibility, or which level pays for goods and services; (2) determination
of the level that delivers each of fifteen major functional activities; and (3)
distribution of public personnel between levels modified by the relative labor
intensity of different services rendered by state and local governments.”
(Stephens & Wikstrom, 2007).
The Local Autonomy Index, developed by Harold Wollman et al
(2008), is the measurement I will be using to represent the degree of
government power and control devolved to the local level. Wollman, of The
George Washington Institute of Public Policy (GWIPP) group, identified three
dimensions of local autonomy:
1.
Local Government Importance: This dimension
analyzes the importance of the actions a local government can take and the
decisions it is free to make, and its position relative to other levels of
government.
2.
Local Government Discretion: This dimension
analyzes local government freedom to act, focusing on fiscal discretion,
functional and legal responsibility, and their ability to raise and spend money
without imposed constraints.
2.
Local Government Capacity: While the authors
conceptually defined "capacity" to include a variety of resources,
competencies and professional qualifications, they operationally defined it as
"stability and diversity of revenue sources." In effect, this measures
the freedom and flexibility of a local government unit with respect to its
ability to spend money.
The index is a combination of standardized measures of each
dimension. The authors of the index report a correlation with the Stephens
Centralization index (or rather, a standardized inverse) of
r = .673, suggesting that it is unnecessary to combine or
otherwise manipulate the separate indices. (Wollman et al, 2008).
Control Variables
To isolate the effect, if any, of community size on local
autonomy I control for elements of what collectively represent social conflict.
Tension and competition between ethnic, social and economic groups may be a
strong impetus for local autonomy; different demands for social services,
different political values, and other social distinctions might push states to
devolve decision-making regardless of community size.
The first control is the percentage of the population of a
state living in the two largest cities. I suggest that the presence of a strong
urban political center, such as New York or Chicago, will result in a strong
rating for local autonomy because of the gravitational pull such large cities
have on political devolution. There is a weak positive correlation between
local autonomy and the percentage of the states' population living in the two
largest cities. The data comes from the United States Census, 2010.
My second control is the Gini index of income inequality for
each state. A Gini index measures the frequency distribution of a data set, in
this case income per capita. An income
inequality gap creates conflicting interests between voters and between
geographic areas within a state, and is a a disincentive to centralization. As
expected, there is a modest positive correlation between local autonomy and
income inequality. The data comes from the United States Census, 2010.
The third control is a Sullivan diversity index, which
measures the probability that two randomly chosen individuals will have a
different ethnic identification. Diversity
is a third source of tension that might drive variation in local autonomy. In
highly homogeneous states, local autonomy may be unnecessary because the
interests and values of all citizens may be relatively closely aligned. By
contrast, highly diverse states might lead to political conflict that could
result in devolved decision-making to please variable constituencies. (U.S.
Mapping Project, 2000).
Descriptive Statistics
N
|
Minimum
|
Maximum
|
Mean
|
Std. Deviation
|
|
% Pop Communites <
2500
|
50
|
.05
|
.61
|
.2641
|
.14567
|
Income Inequality
|
50
|
.412
|
.535
|
.45242
|
.021698
|
Local Autonomy Index
|
50
|
-.982
|
.845
|
-.00002
|
.424178
|
% Pop Living in 2
Largest Cities
|
50
|
.0000
|
.4611
|
.166386
|
.1005144
|
Diversity
|
50
|
.07
|
.73
|
.3658
|
.16408
|
There were a few interesting observations to be made just
from the descriptive statistics. The income inequality range was surprisingly
narrow – on a 0 to 1 scale, only .12 separates the minimum from the maximum.
The other note about the descriptive table is that the .0000 minimum for the %
of the population living in the top two cities represents Vermont – according
to the U.S. Census, there are no large cities in Vermont, so it does not list
population statistics for them.
Findings
Correlation Matrix – Simple Coefficients
Local
Autonomy
|
Income Inequality
|
% Population in
Communities < 2500
|
% Population in
Two Largest Cities
|
Diversity
|
||
Pearson Correlation
|
Local
Autonomy
|
1.000
|
.075
|
-.212
|
.226
|
.350
|
Income Inequality
|
.075
|
1.000
|
-.165
|
-.182
|
.211
|
|
% Population in
Communities < 2500
|
-.212
|
-.165
|
1.000
|
-.213
|
-.618
|
|
% Population in
Two Largest Cities
|
.226
|
-.182
|
-.213
|
1.000
|
.198
|
|
Diversity
|
.350
|
.211
|
-.618
|
0.2
|
1.000
|
|
Significance
|
Local
Autonomy
|
.
|
.302
|
.069
|
.057
|
.006
|
Income Inequality
|
.302
|
.
|
.126
|
.102
|
.071
|
|
% Population in
Communities < 2500
|
.069
|
.126
|
.
|
.069
|
.000
|
|
% Population in
Two Largest Cities
|
.057
|
.102
|
.069
|
.
|
.084
|
|
Diversity
|
.006
|
.071
|
.000
|
.084
|
.
|
|
In a simple bivariate correlation test, the uncontrolled
Pearson correlation coefficient between the proportion of residents in small
communities and the Local Autonomy Index is shown to be slightly negative, but
not significant. (r = -.212). Of
all the variables, only diversity showed correlations at a level of
significance above p = .05. There is a positive correlation between diversity
and local autonomy of r = .350 (p = .006), and between diversity and the %
population living in small communities of r = -.618 (p = .000). The second
diversity correlation is by far the most significant identified in this
report. Below is the uncontrolled
correlation chart showing the relationship between my independent variable, population
in small communities, and the Local Autonomy index.
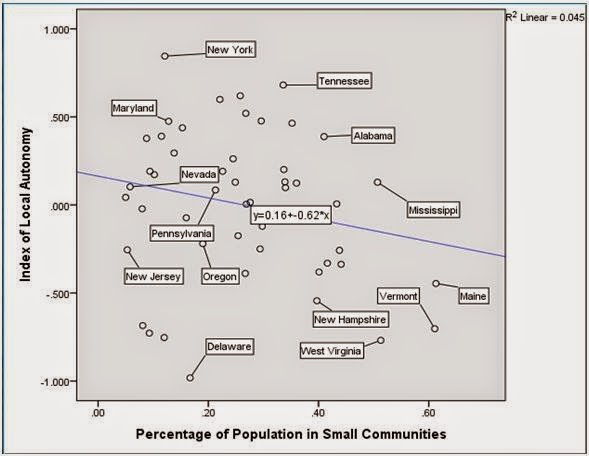
% Population in
Small Communities and Local Autonomy
Uncontrolled scatter plot with line of best fit
The line suggests a slight negative relationship between
population in small communities and local autonomy (the opposite of the
hypothesized relationship), but it is not quite statistically significant (p =
.069). In a finding that corresponds strongly with Stephens index of
centralization (Stephens & Wikstrom, 2007), and as pointed out by Wollman
et al (Wollman et al, 2008), the New England states score low on the local
autonomy index despite a strong tradition of venerating local government. While
Vermont has a centuries-old practice of town meetings, as described in detail
by Bryan in 2004, Vermont nonetheless is one of the most centralized governance
systems in the United States and its local political units appear to enjoy
little decision-making power.
Because two out of three of my control variables (income
inequality and the proportion of a states' population concentrated in the two
largest cities) did not show a significant relationship with local autonomy, I
here show only the results of the primary correlation I am examining controlled
for diversity. As you can see from the below chart, the relationship between
diversity-controlled autonomy and the percentage of a states' population in
small communities is almost exactly zero.
% Population in Small Communities and
Diversity-controlled Local Autonomy

The table below shows the controlled coefficients.
Correlations
|
||||
Control Variables
|
Local Autonomy
|
% Pop in Small
Communities l
|
||
Diversity
|
Local Autonomy
|
Correlation
|
1.000
|
.005
|
Significance (1-tailed)
|
.
|
.485
|
||
% Pop in Small Communities
|
Correlation
|
.005
|
1.000
|
|
Significance (1-tailed)
|
.485
|
.
|
||
A multiple linear
regression removes all independent variables but diversity, and returns the
following results.
Model Summaryb
|
||||
Model
|
R
|
R Square
|
Adjusted R Square
|
Std. Error of the
Estimate
|
1
|
.350a
|
.122
|
.104
|
.401472
|
a. Predictors: (Constant), Diversity
|
||||
b. Dependent Variable: LocalAut
|
||||
As described earlier, the only positive relationship with
local autonomy I was able to identify was diversity. This is shown in the below
graph, with a line of best fit and the linear R squared returned by the
multiple linear regression above.
Diversity and Local Autonomy

The figure below represents the path analysis for all the
variables except diversity.

Conclusions & Further Research
I was unable to find a correlation between community size and
the degree of local political control in each state. While it's possible that
additional controls, different operationalization of "small
community" or other adjustments might reveal a correlation, the results of
this paper suggest that any relationship is at most modest. The positive
benefits of small community size may be outweighed by other factors. Although
it’s purely conjecture, I’ll outline several of these factors as areas for
future research. In states with a high degree of homogeneity, of which there
are many, centralized government may reflect the needs and values of localities
well enough that increased local autonomy may provide no improvement. Even in
states where current conditions might suggest a trend toward greater autonomy, prevailing
historical circumstances at a time when precedents and intergovernmental
relationships were defined may have set a mold for political structures that is
hard to break.
The only significant relationship between independent
variables and my dependent variable is between diversity and local autonomy.
The positive correlation is high enough that while it explains only about 12%
of the variation, it strongly suggests a role for social and political conflict
in determining whether individual states develop devolved political structures
with a broader, more powerful role for local governments. Research in the field
of local political autonomy mostly began in the 1960s and 1970s in the U.S.,
and has primarily focused on defining and understanding centralization and autonomy.
Stephens, Clark, Joyce & Mullins and others used a variety of fiscal and
economic data to describe autonomy in fiscal terms, while Wirt, Bell &
Gabler and others have attempted to introduce other elements of local
government and to identify correlates with greater autonomy. Wirt compared
composite measures of school centralization and their relationship with fiscal
centralization, Bell & Gabler studied the effect of economic growth on centralization
of state services, and Sokolow compared trends in autonomy with local property
tax changes. (Bell, Brunori & Youngman, 2010). But social correlates with
local autonomy appears to be a mainly unexplored area; we don’t know what types
of socioeconomic and political environments give rise to local autonomy, or
allow it to persist over time, and virtually no analysis has been performed on
the comparative efficacy (beyond economic efficiency) of centralized vs.
locally autonomous governance.
While Vetter (2007) describes constituent feelings and
attitudes on local government compared to national and larger subnational
units, the question of what type of society best fosters democracy and local
government remains unanswered. This is a question that, in my view, has serious
implications for international development aid, efforts to promote democracy
and attempts to build liberal political principles into government structures
(especially in the Middle East, as many governments pursue reorganization in the
wake of the Arab Spring). Further research in this area could provide
important, timely insights into the interrelationship between democracy and
sociopolitical conditions.
Bibliography
Vetter, Anjelika. (2007). Local Politics: A resource for democracy in
Western Europe? Plymouth, UK: Lexington Books. (Translated by Antje
Matthaus, originally published by Verlag Leske & Budrich, Leverkausen, DE).
Bell, M., Brunori, D. & Youngman, J
(2010). The Property Tax and Local
Autonomy. Cambridge, MA: Lincoln Institute of Land Policy.
De Tocqueville, Alexis (1835). Democracy in America: Volume 1. Saunders and Otley.
Bryan, F. M. (2004). Real Democracy: The New
England Town Meeting and How It Works. Chicago: University of Chicago Press.
Stephens, G., & Wikstrom, N. (2007). American
Intergovernmental Relations:A Fragmented Federal Policy. New York: Oxford University Press.
Wollman, H., McManmon, R., Bell, M., & Brunori, D.
(2008). Comparing Local Government Autonomy
Across States. George Washington Institute of Public Policy, Working Paper.
Richardson, J. J. (2011). Dillon’s Rule is From
Mars, Home Rule is From Venus: Local Government Autonomy and the Rules of Statutory Construction.
Publius: The Journal of Federalism, 41(4), 662-685
Clark, G. L. 1984. A theory of local autonomy. Annals
of the Association of American
Geographers
74: 195–208.
United States Census, 2010.
U.S. Mapping Project, 2000. United States Census Bureau.
Other References
Bluestein, Frayda.
2006. Do North Carolina Local Governments
Need Home Rule? North Carolina Law Review (1983, republished 2006).
Bowman, Ann;
Kearny, R.C. 2012. Are U.S. Cities Losing
Power and Authority?Perceptions of Local Government Actors. Urban Affairs
Review. (Originally published online at http://uar.sagepub.com/content/48/4/528).
Appendix A: Data
State
|
% Pop Top 2
|
Diversity
|
Pop % Rural
|
Income Inequality
|
Local Autonomy
|
Alabama
|
0.0875
|
0.44
|
0.41
|
0.47
|
0.388
|
Alaska
|
0.4109
|
0.51
|
0.34
|
0.412
|
0.098
|
Arizona
|
0.3075
|
0.53
|
0.1
|
0.453
|
0.172
|
Arkansas
|
0.0959
|
0.36
|
0.44
|
0.459
|
-0.258
|
California
|
0.1369
|
0.67
|
0.05
|
0.469
|
0.043
|
Colorado
|
0.2021
|
0.42
|
0.14
|
0.455
|
0.295
|
Connecticut
|
0.0767
|
0.38
|
0.12
|
0.482
|
-0.753
|
Delaware
|
0.0789
|
0.44
|
0.17
|
0.436
|
-0.982
|
Florida
|
0.065
|
0.52
|
0.09
|
0.535
|
0.378
|
Georgia
|
0.0641
|
0.52
|
0.25
|
0.471
|
0.129
|
Hawaii
|
0.2479
|
0.73
|
0.08
|
0.465
|
-0.685
|
Idaho
|
0.1832
|
0.22
|
0.29
|
0.43
|
-0.25
|
Illinois
|
0.2255
|
0.5
|
0.12
|
0.429
|
0.39
|
Indiana
|
0.1671
|
0.25
|
0.28
|
0.465
|
0.015
|
Iowa
|
0.1082
|
0.14
|
0.36
|
0.434
|
0.124
|
Kansas
|
0.1948
|
0.3
|
0.26
|
0.427
|
0.62
|
Kentucky
|
0.3084
|
0.2
|
0.42
|
0.444
|
-0.331
|
Louisiana
|
0.1265
|
0.5
|
0.27
|
0.464
|
0.52
|
Maine
|
0.0498
|
0.07
|
0.61
|
0.475
|
-0.446
|
Maryland
|
0.1248
|
0.53
|
0.13
|
0.434
|
0.475
|
Massachusetts
|
0.122
|
0.32
|
0.08
|
0.441
|
-0.022
|
Michigan
|
0.0912
|
0.36
|
0.25
|
0.469
|
-0.175
|
Minnesota
|
0.1259
|
0.22
|
0.27
|
0.449
|
-0.389
|
Mississippi
|
0.0813
|
0.5
|
0.51
|
0.438
|
0.129
|
Missouri
|
0.1301
|
0.29
|
0.3
|
0.474
|
0.477
|
Montana
|
0.1728
|
0.19
|
0.44
|
0.45
|
-0.337
|
Nebraska
|
0.3654
|
0.23
|
0.27
|
0.437
|
0.004
|
Nevada
|
0.3116
|
0.53
|
0.06
|
0.432
|
0.103
|
New Hampshire
|
0.1489
|
0.1
|
0.4
|
0.437
|
-0.544
|
New Jersey
|
0.0597
|
0.53
|
0.05
|
0.421
|
-0.255
|
New Mexico
|
0.3125
|
0.62
|
0.23
|
0.463
|
0.191
|
New York
|
0.4611
|
0.57
|
0.12
|
0.459
|
0.845
|
North Carolina
|
0.1191
|
0.46
|
0.34
|
0.498
|
0.131
|
North Dakota
|
0.248
|
0.16
|
0.4
|
0.463
|
-0.381
|
Ohio
|
0.1026
|
0.28
|
0.22
|
0.444
|
0.599
|
Oklahoma
|
0.2591
|
0.43
|
0.34
|
0.45
|
-0.033
|
Oregon
|
0.1931
|
0.29
|
0.19
|
0.459
|
-0.22
|
Pennsylvania
|
0.1442
|
0.28
|
0.21
|
0.446
|
0.085
|
Rhode Island
|
0.2477
|
0.32
|
0.09
|
0.458
|
-0.728
|
South Carolina
|
0.0539
|
0.48
|
0.34
|
0.456
|
0.201
|
South Dakota
|
0.2725
|
0.22
|
0.43
|
0.461
|
0.006
|
Tennessee
|
0.2007
|
0.35
|
0.34
|
0.44
|
0.681
|
Texas
|
0.1363
|
0.61
|
0.15
|
0.469
|
0.438
|
Utah
|
0.1143
|
0.26
|
0.09
|
0.472
|
0.191
|
Vermont
|
0
|
0.08
|
0.61
|
0.413
|
-0.703
|
Virginia
|
0.0851
|
0.47
|
0.25
|
0.432
|
0.262
|
Washington
|
0.1216
|
0.37
|
0.16
|
0.457
|
-0.073
|
West Virginia
|
0.0277
|
0.1
|
0.51
|
0.441
|
-0.769
|
Wisconsin
|
0.1456
|
0.23
|
0.3
|
0.454
|
-0.121
|
Wyoming
|
0.2036
|
0.21
|
0.35
|
0.429
|
0.464
|


Comments
Post a Comment